
Configure PhpStorm for local PHP Web Application Debugging
In a previous article I talked about getting php, xdebug and PhpStorm all working together. That left me with the ability to debug php files right in the IDE. While helpful, debugging an individual php file has limited value. This article will cover the steps I had to go through to get PHP Web Application debugging to work
Notes:
- JetBrains Documentation
- PhpStorm 4.0 Help file on Debugging [jetbrains.com]
- Create a PhpStorm Web App Debug configuration [jetbrains.com]
- Helpful: Blog post on 'zero configuration' debugging with PhpStorm [blog.jetbrains.com]
- Important: Bookmarklet debug script generator [jetbrains.com]
- xdebug Documentation
- Important: information on xdebug.remote_host setting (php.ini) [xdebug.org]
- Starting the Debugger [xdebug.org]
- Note: I am continuing this configuraion on my Mac. For other platforms some changes may need to be made
Configure xdebug settings in php.ini
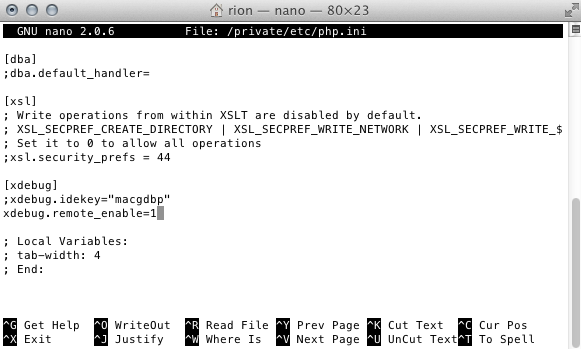
On my Mac, the php.ini file is located in /private/etc/php.ini. Do a search for xdebug and you should find at least one commented-out configuration option towards the bottom of the file. You can add additional xdebug settings below that line.
I had to add a single line. Here is my [xdebug] configuration. Bolded line was added by me:
[xdebug]
;xdebug.idekey="macgdbp"
xdebug.remote_enable=1
Here's that change in context with my php.ini file. You can see there isn't much to the xdebug configuration:
Note 1: xdebug defaults to certain settings when you don't specify them. Here are the xdebug settings that you should be concerned with to make PhpStorm Happy. These will be important later on:
xdebug.remote_enable 1
xdebug.remote_host localhost
xdebug.remote_port 9000
Note 2: Be sure to restart your httpd daemon after making these changes
Configure your Web Server
For PhpStorm to be happy about debugging web applications you must configure your http server to have a (virtual) directory that points to you PHP Project. I accomplished this by creating a symlink to my PhpProjects directory in my html document root folder. On the mac you can pick from your personal website (/Users/username/Sites) or the computer site (/Library/WebServer/Documents). For typing ease I placed my symlink in the Computer site:
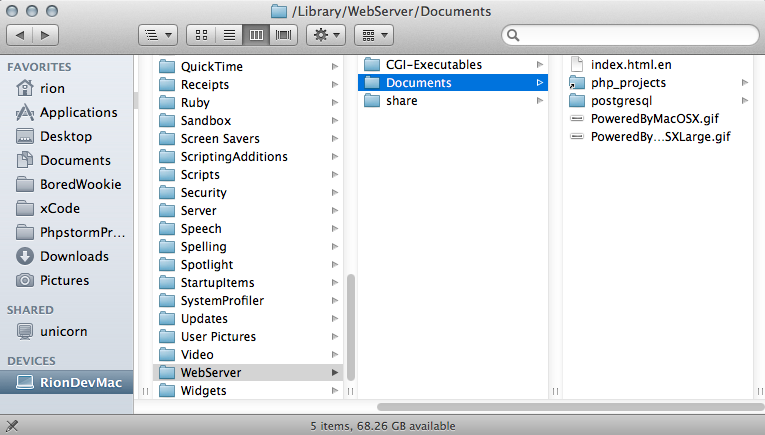
With the above configuration my Php Project base URL is: http://localhost/php_projects/
This will be used when we setup a PhpStorm Web App Debug configuration. PhpStorm uses it to keep track of what files correspond with which URL requests. You can set PhpStorm up to 'push' files out to a different location if that floats your boat
Setup a PhpStorm PHP Web App debug configuration
PhpStorm needs to know a few things before you can hit the 'play' button and debug your PHP Web App. First, make sure that the xdebug settings are configured correctly:
- Open PhpStorm Preferences (On Mac PhpStorm -> Preferences, Others: File -> Settings)
- Select Php -> Debug
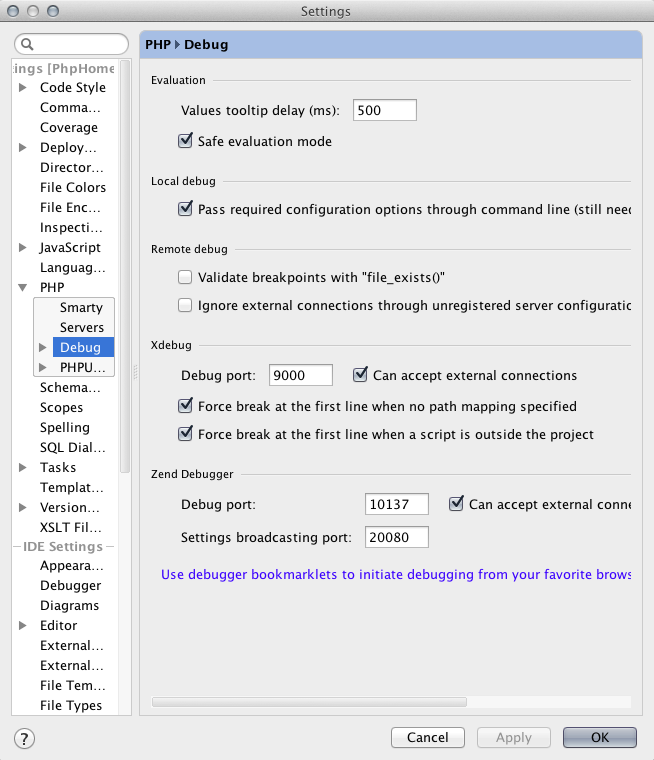
Be sure that the Port is correct (9000 is the default 'zero config' option for xdebug) and that Can Accept Remote Connections is checked
Next We'll setup a Web App Debug Configuration to store configuration settings specific to your Php Project:
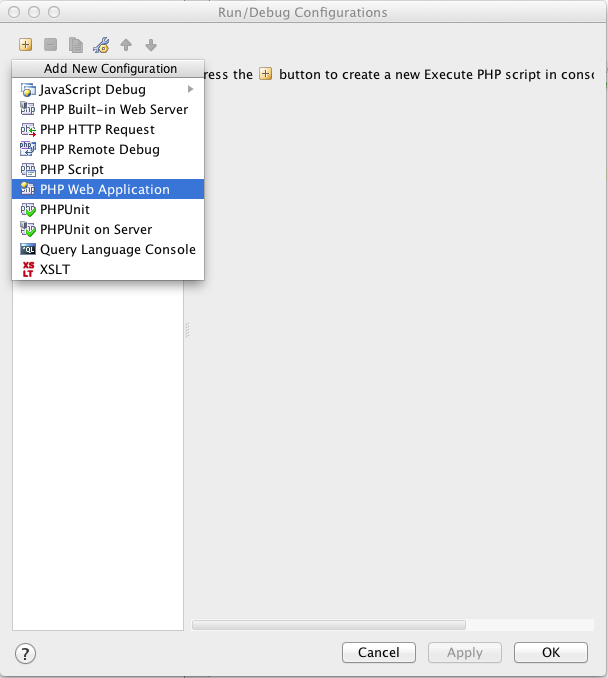
- Select Edit Configurations from the Run configuration drop-down
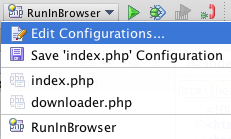
- Click the Plus Sign button and select PHP Web Application
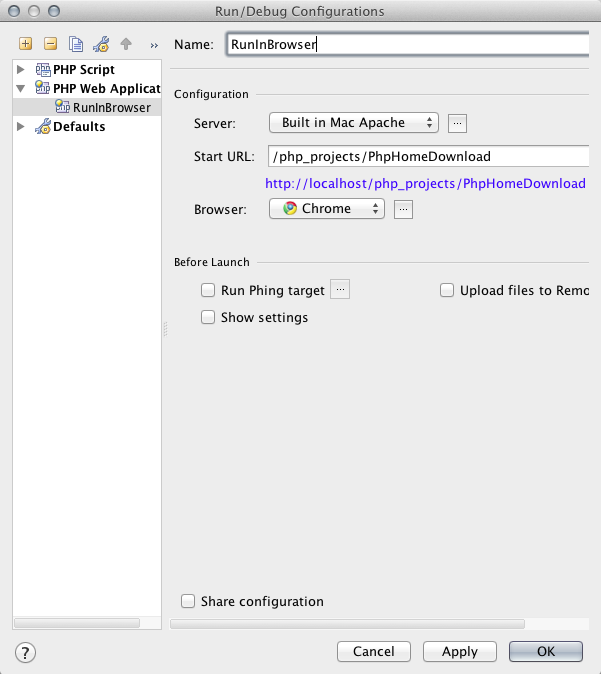
- Be sure to add the following information:
- Name - This is how you will be able to identify & Run your debug configuration
- Server - This is the Server Base URL that PhpStorm will use for debugging
- Start URL - Path that gets appended to the server base URL to create a project base URL
- Browser - When the Web app is started, you can have it start in one of several browsers. Pick the one you want
- I haven't had to use the other settings Run Phing target, Show settings, Upload files to Remote Host
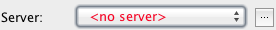
- If this is your first time configuring a PhpStorm Web Application Configuration, you will need to setup a Server before you can use it.
- Click the '...' button next to the Server dropdown
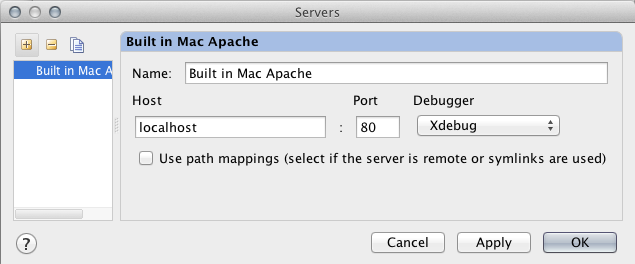
- Click the + sign button and give your server a Name, Host, Port and Debugger. Since I'm just using the built-in local apache httpd server (Provided by Apple Web Sharing) I just entered in the basic information to connect to my Computer site (http://localhost:80)
- Your final Web Application Debug configuration should look something like this:
- If successful, you'll see your configuration show up in the drop-down (See bottom of screenshot):
Add debug bookmarklets to the browser you picked for the Web App Debug configuration
While there are supposedly a few different ways you can debug a PHP Web application, the only one that worked for me is the one that has you setup Debug Bookmarklets in your browser. We'll use them in the next section to actually debug a PHP Web Application:
- Open your debugging browser of choise (set in the PHP Web App Debug configuration in the previous section)
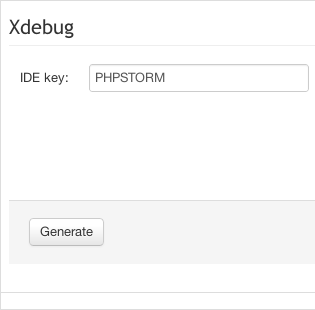
- Go to the JetBrains Zend and xdebug bookmarklet generator page and click the Generate button. In my testing the IDE Key doesn't appear to be super important
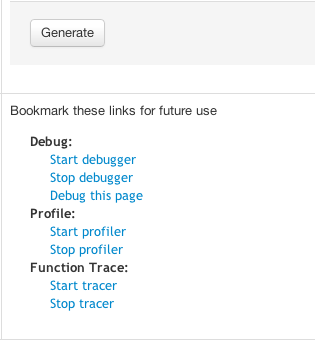
- You will see a list of available BookMarklets. Add all the Debug ones to your shortcut bar
- I had to Right-Click -> Copy Link Address... and paste the contents into a new shortcut. Chrome wouldn't let me drag/drop the links
At this point all of the pre-requisites to debug a PHP Web application should be met. We can move on to using PhpStorm to actually debug
Debugging a PHP Web App with JetBrains PhpStorm
One Final thing that should be mentioned before you start debugging: Ensure that your FireWall does not block PhpStorm from accepting inbound connections. As PhpStorm acts as a client waiting for xdebug to contact it, it needs to be able to listen on the debug port without interference
- Open your PHP Project in PHPStorm
- Choose your run configuration from the list

- Click the Telephone icon to turn it Green

(This means that we are ready to act as a client to xdebug)
- Set a Break Point in the PHP File you want to debug

- Click the Debug
 button to start the web application running
- In the Web Browser click the Start Debugging Bookmarklet you saved from the Bookmarklet Generator

Note: I found that I only had to click this bookmarklet once as long as I left the browser open between debug attempts - Depending on where you placed your first break point, you may have to click around to set it off. In my case I had to fill out a form and click a 'submit' button on my website before the break-point I set got hit.
Once Hit, the debug area at the bottom of the window pops-up: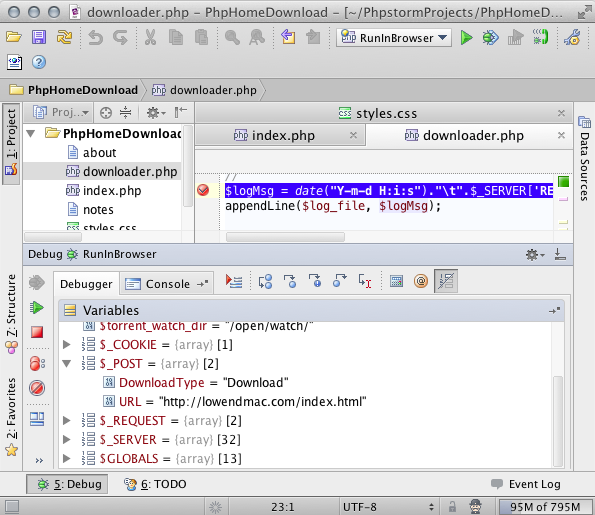
In the Debug Window you can see the state of all local and global variables. There is also a Console tab where you can see any console messages.
When in Debug Mode you can step in/out/through your PHP Code. I have found this to be VERY helpful in debugging my PHP Web Apps.
Final Notes
- Since I'm not in PHP All day every day it can sometimes be a struggle just to get something to 'work'. PhpStorm helps me to get things to work in half the time I used to get things done (Stand alone text editor, 'echo' statements for troubleshooting & Debugging).
- PhpStorm is an extension of WebStorm, which means that it is well suited to writing & debugging JavaScript code as well as PHP. I've been working with the JavaScript functionality for a bit longer than the PHP (A whole 2 days longer) and have found it to be extremely useful and helpful.
- I think there is still room for improvement in both the PHP and JavaScript sides of the product. As a paying customer I look forward to getting the next year's worth of updates for free. :)